- STAGE:
- Complete
- PROJECTED DONE:
- Q2 - 2023
TABLE OF CONTENTS:
Web Portal
Improvements to Session Analytics Charts
STAGE:
Complete
PROJECTED DONE:
Q2 - 2023
TABLE OF CONTENTS:
The overview in the top left shows the total time in apps.
The View By options now include 1 day, 7 days, 1 month, year to date, and all. Selecting one of these options updates the graph accordingly.
Previously on hovering over the line graph it would only show one line graph's information. Now multiple lines are shown.
Users can toggle on/off apps from the graph to view or hide the corresponding app's analytics.
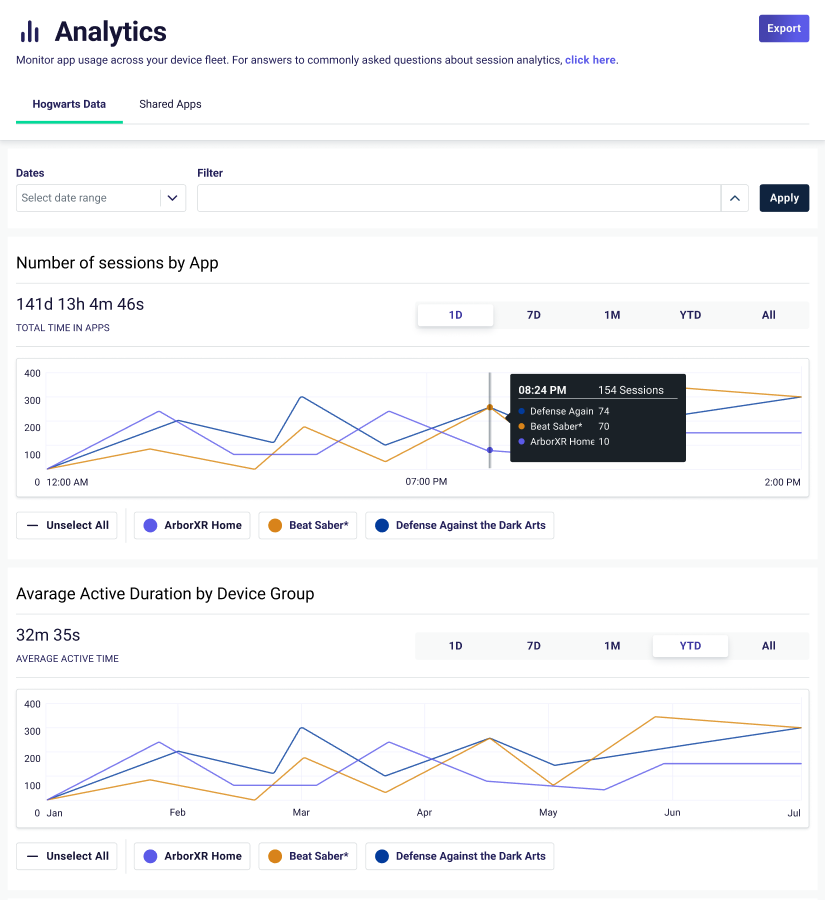
TABLE OF CONTENTS: